Map
Diana LaScala-Gruenewald
7/12/2021
Install packages
# require() is like library() except it returns F if the package is missing
if (!require(librarian)){
  install.packages('librarian')
  library(librarian)
}

# librarian::shelf() is like library() except it installs a package if it's missing
# even from GitHub if the owner/repo are included
shelf(
  NOAA-EDAB/ecodata,
  sf,
  quiet=T
)
Get spatial data
These data are part of an ecological indicator status data set generated by NOAA. It gives the Ecological Production Units for a set of ocean regions in the western Atlantic: Mid-Atlantic Bight (MAB), Georges Bank (GB), Gulf of Maine (GOM), and Scotian Shelf (SS).
# Look at the structure of what we downloaded
ecodata::epu_sf
## Simple feature collection with 4 features and 3 fields
## Geometry type: MULTIPOLYGON
## Dimension: XY
## Bounding box: xmin: -77 ymin: 35.8327 xmax: -65.66667 ymax: 44.66667
## Geodetic CRS: NAD83
## EPU Shape_Leng Shape_Area geometry
## 0 GB 16.33086 6.162033 MULTIPOLYGON (((-66.5 42.16...
## 1 GOM 32.20684 7.545063 MULTIPOLYGON (((-69.26278 4...
## 2 SS 20.52712 3.350430 MULTIPOLYGON (((-67.54 44.6...
## 3 MAB 83.38407 15.695390 MULTIPOLYGON (((-75.97418 3...# Set the crs to WGS84
epu_sf <- ecodata::epu_sf %>%
st_transform(4326)
# Plot all data (all three columns except for the geometry column)
plot(epu_sf)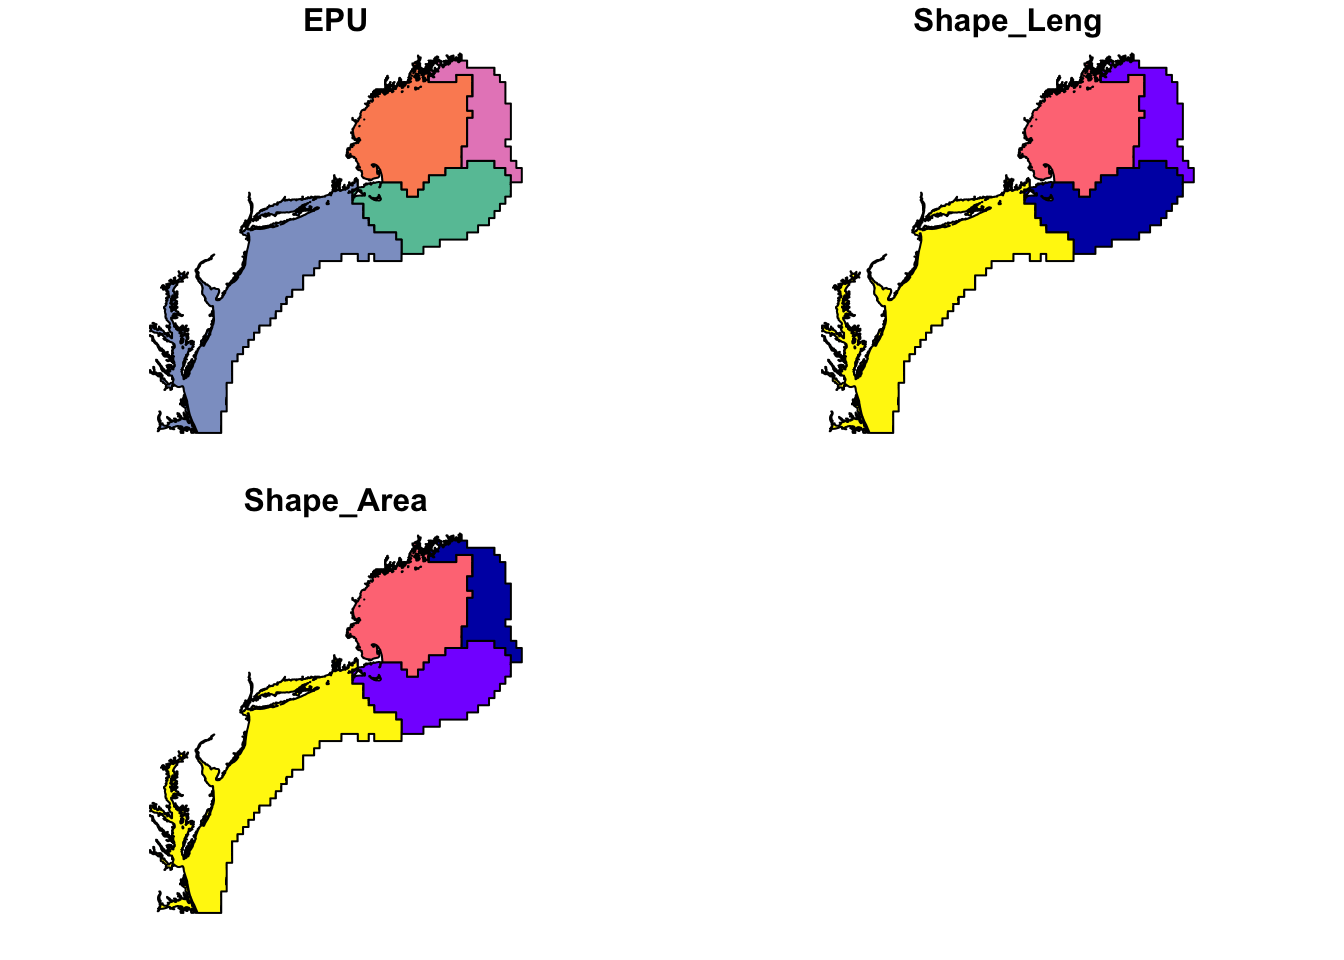
Static maps
# Plot just the EPU data
plot(epu_sf['EPU'])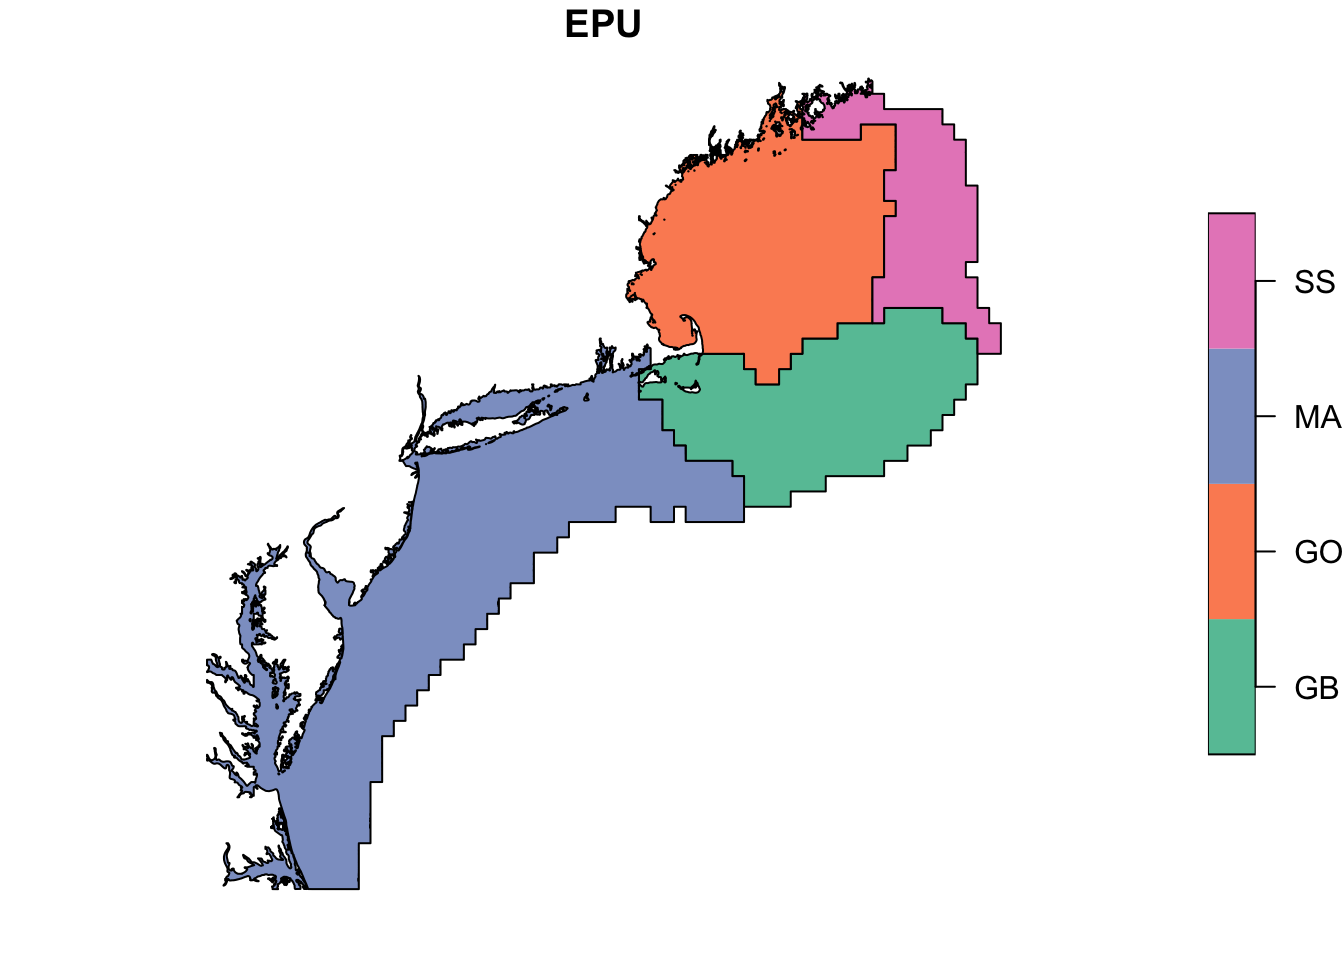
So, where in the world is this? We can add a basemap to find out.
Interactive maps
# Make sure mapview is installed and load it
shelf(mapview, quiet=T)

# Plot
mapview(epu_sf)
shelf(leaflet, quiet=T)
leaflet() %>%
# Add tiles
addProviderTiles(providers$Esri.OceanBasemap) %>%
# Add data
addPolygons(data = epu_sf)